Contents

RSG Application
WhatsNew
The Login Page
RSG Mode Selection
The Ready Reports Page
The Search Page
Tell me about Box
Search Options
Surveys / Matching Surveys
Search Results & Save Q&As
Ready Reports
The Reports Page
Report Definition
Report using Q&A Catetegories
Report using TNT+ OwnCodes
Comparison Reports
Report using Integrated Media
Row Highlighting and Filtering
The Report
Exporting
Export to Excel
Export To PowerPoint
PowerPoint Templates
Multi-Column Reports Page
Multi Column Report Options
Multi Column Charting
The Preferences Page
General
Charts
Saved Q&As
PowerPoint Templates
Search Sets
PreSets for MultiColumn Comparison Reports

 
Home
The ReSearch Guru Standard Edition
Prev Page Next Page
 
  Preferences - Charts


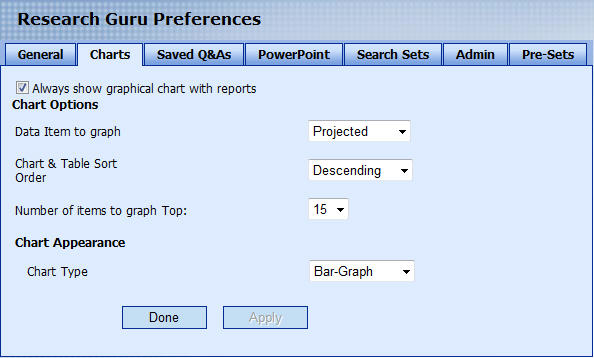
Preference options for Charts include:

  1. Always show graphical charts with reports - Uncheck to hide graphs
  2. Data Item to graph- Choose default data item
  3. Sort Order - Choose default sort order. Affects table as well
  4. Number of items to graph - 5, 10, or 15
Chart Appearance:
  • Chart Type - Bar, Pie, Line, etc

  • Click on Apply to save your settings.
    Click on Done to come out of the Preferences page.
Converted from CHM to HTML with chm2web Pro 2.8 (unicode)